In September 2020, I was privileged to do a presentation for the Credit Union National Associations’ Marketing & Business Development conference. I was supposed to deliver this presentation in March 2020 in Orlando, FL to a live audience, but, COVID-19 happened. The presentation was about using digital marketing for business development with an emphasis on how to attract new SEGs and increase utilization.
Anyone who knows me knows that I can talk endlessly about digital marketing and I managed to do just that during my presentation. Q&A was eliminated, but, there was a question about how to build an audience profile that a credit union’s business development team could utilize. While there are many tools and methods to build an audience profile, this post will help you build an audience profile using 3 tools that are commonly utilized (Google Analytics, LinkedIn and Facebook) and one (CRM) that will require assistance from us or your current digital marketing partner.
Getting Data for Your Audience Profile
To start pulling together an audience, you’ll need the following data sources:
- Google Analytics
- Facebook Insights
- CRM
Google Analytics
Google Analytics gives you plenty of data to work with that will be very helpful in creating your audience profile. You can learn about your visitors’ demographics, interests, location, technology used to visit your site and generally get data of other behaviors on your site.
The first thing you’ll do is create a segment so you can isolate visitor behaviors to a specific page or set of pages that are relevant to your SEG program. If your SEG program pages live on a separate site it’ll be much easier to analyze visitor behavior, but, I’ll assume your SEG pages are within the credit union’s main website.
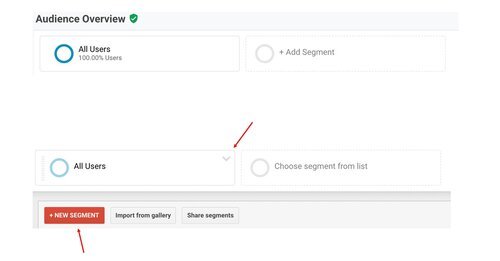
In Google Analytics, look for a box similar to the image on the right that says All Users. Click on that box and you’ll see it expand similar to the image on the bottom of the image to the right. Click on New Segment.


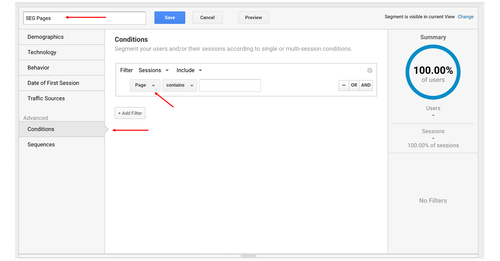
The next step is to create the segment. Give your new segment name (I’ve named it SEG Pages). Then go to Conditions under Advanced. By default, there will be a drop down that says Ad Content. Click on that and search for Page and select that as your dimension. In the field to the right of contains, you will put the part of the URL after the first “/”that is for your SEG page. So, if the URL in your browser is AwesomeCreditUnion.org/become-a-SEG, then you’ll want to copy and paste “/become-a-SEG” into the field.
You will then see a Summary of users and sessions on the right. Click Save and you can start analyzing the data.
Reports to Use in Google Analytics
Once the SEG segment is created, you can activate the segment to look at that traffic solely or compare it to other segments (e.g. All Users). Here are reports to use in Google Analytics:
- Audience > Demographics: use this to get a sense of the age and gender makeup of the audience.
- Audience > Interests: this report will give you insight into the audience’s affinities (what they tend to be interested in over a longer period of time) and what they’re in-market for (e.g. banking services, investment services, cars, homes, etc.).
- You can use this data to inform targeting strategies for a display campaign. For example, if your SEG visitor data shows affinity propensities for Lifestyles & Hobbies/Business Professionals and Banking & Finance/Avid Investors andin-market behaviors for Financial Services/Banking Services and Financial Services/Investment Services, you may want to consider placing ads on WSJ.com, etc.
- Audience > Geo > Location: you can get down to the City level and see where your visitors are coming from. Use this data to shore up locations of strength (e.g. locations near your branches) and to identify areas of opportunity (e.g. an area where you have no branch location, but, there are a lot of prospects).
- Audience > Mobile: are your visitors getting to your site via desktop/laptop, mobile devices or tablets? Use this data to develop creative assets (e.g. banner ads, landing pages) and develop an understanding of where people are consuming your information (e.g. desktop may indicate a formal work place, whereas, mobile may indicate consumption during a commute, lunch break, etc.).
- Acquisition > All Traffic > Channels: this data will tell you how visitors are getting to your site.
- Determine effectiveness of any campaigns you may be running to promote your SEG program (use this tool to develop better tracking links)
- Look at the Organic Search report to see which keywords people are using in Google/Bing/Yahoo/etc to get to your SEG page(s). The keywords may make sense right off the bat or you may find that people are searching for what you offer in ways you didn’t think of (this happens more often that not). SEO (search engine optimization) may be needed, but, that’s a whole other topic. You may need to work with your marketing team to get access to more thorough search query data from Google Search Console (if it’s not linked to Google Analytics).
- Referrals: use this report to see which sites are sending traffic to your site. You may find opportunities to partner with another site (e.g. sponsorships) or even pitch your SEG program.
- Behavior > Site Content: which pages are visited by your audience?
- Behavior > Site Search: these are the search queries a visitor enters into your site’s search function. This is useful for getting to know what solutions your visitors are seeking.
- Conversions > Goals: set up goals to track conversions (micro and macro conversions) that are relevant to your objectives.
- Micro-conversion: this is a small step taken toward the ultimate goal. For example, this could be someone downloading a whitepaper.
- Macro-conversion: this is the ultimate goal and could be a submitted application to become a SEG partner.
Use the data from these reports to begin developing an understanding of your audience.
The next post will go over how to use LinkedIn to develop an audience profile.